


NEW LISTING: #58 11720 Cottonwood Dr, Maple Ridge
NEW LISTING: BIG & ROOMY❗️ $678,000 Just Listed ❗️Fantastic spacious townhome with finished basement , BACKS ON TO GREENBELT ❗️ 58 11720 COTTONWOOD Drive, Maple Ridge


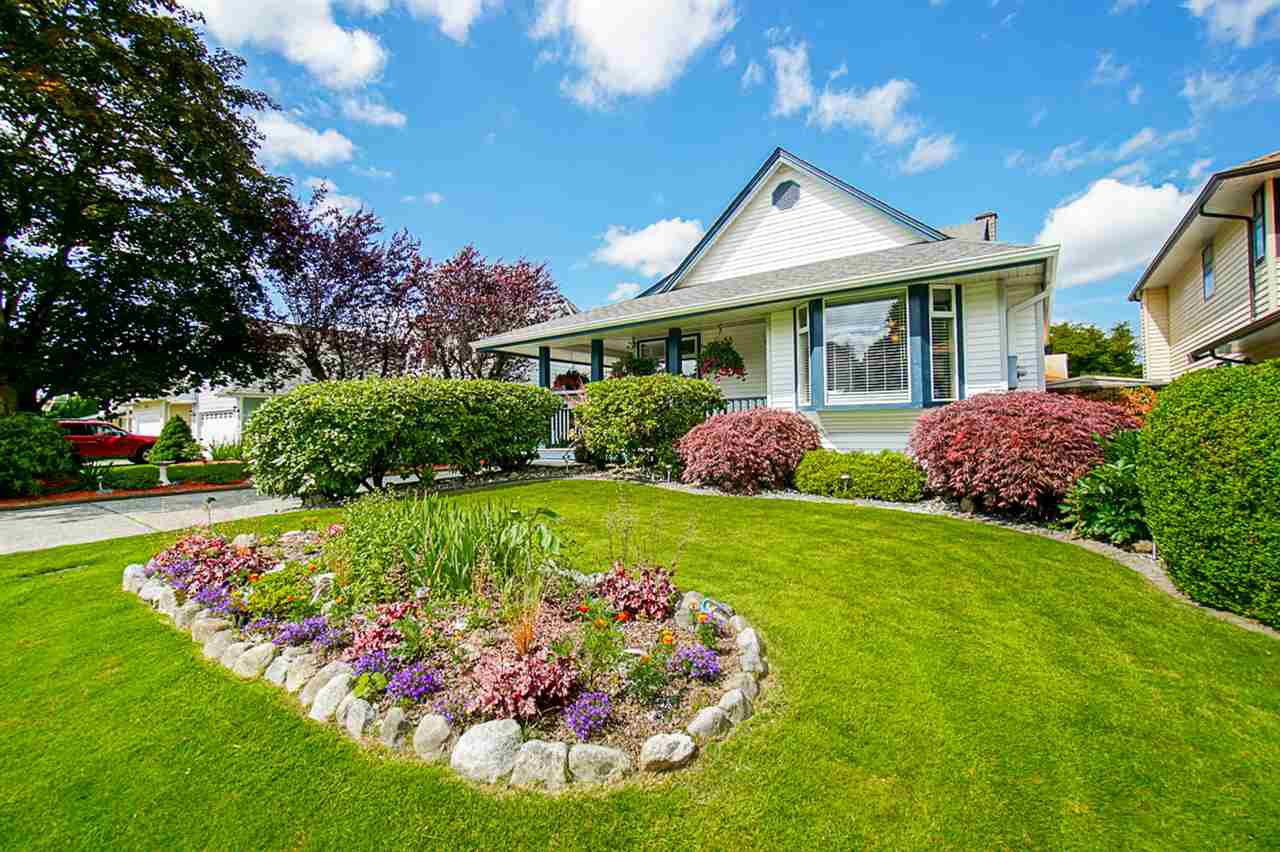

Home prices remain steady, buyers and sellers become more comfortable operating in today’s market
Metro Vancouver home prices have remained steady since provincial health officials implemented physical distancing requirements in March.
The Real Estate Board of Greater Vancouver (REBGV) reports that the MLS® Home Price Index1 composite benchmark price for all residential properties in Metro Vancouver today is $1,028,400. This is virtually unchanged from April 2020, a 1.4 per cent increase over the last three months, and a 2.9 per cent increase compared to May 2019.
"Home prices have been stable during the COVID-19 period," Colette Gerber, REBGV Chair said. "While we’re seeing a variety of long-term projections for the market, it's critical to understand the facts and trends as they emerge."
Residential home sales in the region totalled 1,485 in May 2020, a 43.7 per cent decrease from the 2,638 sales recorded in May 2019 and a 33.9 per cent increase from the 1,109 homes sold in April 2020.
Last month’s sales were 54.4 per cent below the 10-year May sales average.
"Home sale and listing activity is down compared to typical, long-term levels and up compared to the activity we saw in April 2020," Gerber said. "Home buyers and sellers are adapting today, becoming more comfortable operating with the physical distancing requirements that are in place in the market."
There were 3,684 detached, attached and apartment properties newly listed for sale on the Multiple Listing Service® (MLS®) in Metro Vancouver in May 2020. This represents a 37.1 per cent decrease compared to the 5,861 homes listed in May 2019 and a 59.3 per cent increase compared to April 2020 when 2,313 homes were listed.
"Home buyers and sellers are working with their REALTORS® to use new tools to complete different stages of the real estate transaction virtually," Gerber said. “When in-person interactions are necessary, we’re working with our clients to follow the physical distancing requirements set out by WorkSafeBC and the provincial health officer."
The total number of homes currently listed for sale on the MLS® system in Metro Vancouver is 9,927, a 32.4 per cent decrease compared to May 2019 (14,685) and a 5.7 per cent increase compared to April 2020 (9,389).
For all housing types, the sales-to-active listings ratio for May 2020 is 15 per cent. By housing type, the ratio is 13.5 per cent for detached homes, 18.9 per cent for townhomes, and 14.8 per cent for apartments.
Generally, analysts say downward pressure on home prices occurs when the ratio dips below 12 per cent for a sustained period, while home prices often experience upward pressure when it surpasses 20 per cent over several months.
Sales and benchmark prices by property type
Sales of detached homes in May 2020 reached 534, a 41.5 per cent decrease from the 913 detached sales recorded in May 2019. The benchmark price for detached properties is $1,456,700. This is a 0.3 per cent increase from April 2020, a 2.2 per cent increase over the past three months, and a 2.9 per cent increase compared to May 2019.
Sales of apartment homes reached 653 in May 2020, a 47.6 per cent decrease compared to the 1,246 sales in May 2019. The benchmark price of an apartment home is $686,500. This is a 0.3 per cent decrease from April 2020, a 0.9 per cent increase over the past three months, and a three per cent increase compared to May 2019.
Attached home sales in May 2020 totalled 298, a 37.8 per cent decrease compared to the 479 sales in May 2019. The benchmark price of an attached home is $792,700. This is a 0.2 per cent increase from April 2020, a 1.2 per cent increase over the past three months, and a 1.8 per cent increase compared to May 2019.
Home sales and listings down amid COVID-19, new tools and practices emerge to help buyers and sellers adapt
While Metro Vancouver home sale and listing activity remains limited by the COVID-19 situation, REALTORS® across the region are fast adopting new tools and practices to help advise and serve their clients in a responsible way.
The Real Estate Board of Greater Vancouver (REBGV) reports that residential home sales in the region totalled 1,109 in April 2020, a 39.4 per cent decrease from the 1,829 sales recorded in April 2019, and a 56.1 per cent decrease from the 2,524 homes sold in March 2020.
Last month’s sales were 62.7 per cent below the 10-year April sales average and was the lowest total for the month since 1982.
“Predictably, the number of home sales and listings declined in April given the physical distancing measures in place,” Colette Gerber, REBGV’s president-elect said. “People are, however, adapting. They’re working with their Realtors to get information, advice and to explore their options so that they’re best positioned in the market during and after this pandemic.”
Realtors have been named an essential service by the provincial government to help the home buying and selling community meet their housing needs during the pandemic.
“We’re seeing more innovation in today’s market, with Realtors using different technology to showcase homes virtually, assess neighbourhood amenities with their clients and handle paperwork electronically,” Gerber said.
There were 2,313 detached, attached and apartment properties newly listed for sale on the Multiple Listing Service® (MLS®) in Metro Vancouver in April. This represents a 59.7 per cent decrease compared to the 5,742 homes listed in April 2019 and a 47.9 per cent decrease compared to March 2020 when 4,436 homes were listed.
The total number of homes currently listed for sale on the MLS® system in Metro Vancouver is 9,389, a 34.6 per cent decrease compared to April 2019 (14,357) and a 2.3 per cent decrease compared to March 2020 (9,606).
For all property types, the sales-to-active listings ratio for April 2020 is 11.8 per cent. By property type, the ratio is 10 per cent for detached homes, 14.7 per cent for townhomes, and 12.4 per cent for apartments.
Generally, analysts say downward pressure on home prices occurs when the ratio dips below 12 per cent for a sustained period, while home prices often experience upward pressure when it surpasses 20 per cent over several months.
The MLS® Home Price Index composite benchmark price for all residential properties in Metro Vancouver is currently $1,036,000. This represents a 2.5 per cent increase over April 2019 and a 0.2 per cent increase compared to March 2020.
“Home prices have held relatively steady in our region since the COVID-19 situation worsened in March,” Gerber said.
Sales of detached homes in April 2020 reached 388, a 33.8 per cent decrease from the 586 detached sales recorded in April 2019. The benchmark price for detached properties is $1,462,100. This represents a 2.3 per cent increase from April 2019 and a 0.8 per cent increase compared to March 2020.
Sales of apartment homes reached 503 in April 2020, a 43.2 per cent decrease compared to the 885 sales in April 2019. The benchmark price of an apartment property is $685,500. This represents a 2.7 per cent increase from April 2019 and a 0.2 per cent decrease compared to March 2020.
Attached home sales in April 2020 totalled 218, a 39.1 per cent decrease compared to the 358 sales in April 2019. The benchmark price of an attached home is $796,800. This represents a 2.8 per cent increase from April 2019 and a 0.6 per cent increase compared to March 2020.

April 2020
Is It Different This Time? Recessions and the BC Housing Market
Summary Findings:
The Canadian economy has weathered three recessions in the past 40 years, each unique in cause, depth and duration. However, there is considerable similarity in how the BC housing market has both endured and recovered from those recessions.
In this market intelligence, we examine the impact of past recessions on the BC housing market and provide preliminary projections on how COVID-19 may impact provincial home sales and prices over the next 24 months.
The 2020 Recession – How bad and how long?
The 2020 recession likely began in February, meaning it is still in its very early stages. Since 1980, the average Canadian recession has lasted between 8 and 25 months and is characterized by a contraction of about 4 per cent in real GDP and a jump in the unemployment rate of 4.5 percentage points.
Provincial economic data is only available annually, making it much harder to track the duration of recessions. We know that during the 1981/82 recession, the BC economy contracted by 6.4 per cent, and the unemployment rate jumped nearly 10 points in the worst recession on record for British Columbia.
The provincial economy performed much better in the 1990-92 recession, with real GDP eking out meager growth over that period, though the provincial unemployment rate did spike to nearly 11 per cent. During the 200809 Financial Crisis and recession, we estimate the BC economy peaked in November of 2008 and contracted 3.7 per cent over the following 12 months while the unemployment rate rose more than 4 points.
|
Recession Dates |
Duration (months) |
Decline in Real GDP (Peak to Trough) |
Peak Unemployment Rate |
Rise in Unemployment Rate (percentage points) |
|||
|
Canada |
BC |
Canada |
BC |
Canada |
BC |
||
|
1981/82 |
16 |
-4.5% |
-6.4% |
13.1% |
15.7% |
6.0 |
9.8 |
|
1990/92 |
25 |
-3.4% |
+ 0.3% |
12.1% |
10.9% |
4.8 |
3.1 |
|
2008/09 |
8 |
-4.4% |
-3.7% |
8.7% |
8.3% |
2.9 |
4.2 |
Our current forecast is for the Canadian economy to contract approximately 4 per cent in the first quarter of 2020, followed by a startling 21 per cent decline in the second quarter on a seasonally adjusted annualized basis (on a non-annualized basis, the second quarter decline is roughly 5 per cent). The peak-to-trough decline in total Canadian output will likely be on the order of about 7 per cent before the economy starts to grow again.
Likewise, our tracking of the BC economy indicates that provincial real GDP growth will turn negative in February and the contraction of the economy may reach double digits by April, reflecting the shutdown in economic activity.
The COVID-19 recession is unprecedented in that it is not man-made. It did not evolve due to collective poor business decisions, bad loans, or misadventures in financial engineering. Rather, the economy has been purposely halted for the greater good. The implication being that, the shorter the duration of this unusual period, the more likely it is that demand can snap back to near where it was pre-COVID-19. However, the longer the duration, the more likely that jobs do not return, businesses fail, and the recovery is much slower.

While a recession looks to be unavoidable, the country has already experienced staggering job losses in March and, just as there are necessary measures to flatten the curve of COVID-19, we can also implement measures to flatten the recession curve. Fortunately, Canadian policy makers are following the playbook to do just that. If these policies are working, we expect the pace of job losses to slow considerably, and the number of EI claims and business failures to decline.
|
Policies to Flatten the Recession Curve ❑ Ensure workers can remain employed and collect paycheques even if quarantined ❑ Ensure firms can survive through easier borrowing terms and financial assistance ❑ Support financial system as non-performing loans mount to stave off financial crisis |
Source: Pierre Gourinchas, “Flattening the Pandemic and Recession Curves,” April 2020
In past recessions, BC home sales typically posted an initial steep decline before bouncing back along with the wider economy. In the year following the start of a recession, home sales have recorded significant recoveries, rising 24 to 46 per cent, largely as a result of pentup demand and low interest rates.
In the COVID-19 recession, we expect home sales will decline approximately 30-40 per cent year-over-year in April 2020 and remain depressed over the summer as households and the real estate sector adhere to social distancing. As measures to mitigate the spread of COVID-19 are gradually lifted, we expect that pent-up demand and low interest rates will entice buyers back into the market. We project home sales will return to a baseline 85,000-unit annual pace by early 2021.

The response of home prices to prior recessions was broadly similar to that of home sales, with average home prices initially declining before springing back as the Bank of Canada lowers interest rates, and pent-up demand builds. Those factors are often powerful enough that home prices finish the year higher following the initial decline. The one clear outlier is the 1981/82 recession in which prices were crashing following a 41 per cent increase the year prior and an increase in mortgage rates to a now unimaginable 22 per cent.
Crucially, the impact on prices is largely determined by the reaction of supply. If the inventory of listings accumulates significantly, and particularly if that inventory represents foreclosures or desperation selling by those impacted by rising unemployment, then prices will be more severely impacted.
Our COVID-19 model assumes that listings accumulate as in past recessions. However, given the unusual nature of COVID-19, listings are likely to decline for at least the first month due to social distancing before normal recession dynamics take over and listings begin to rise. That alternative scenario is represented by the broken line in the adjacent chart.

While a recession in Canada and BC is at this point unavoidable, the one thing all recessions have in common is that they end. We know from history that the housing market bounces back with vigor following recessions, usually aided by a steep drop in interest rates. We expect this time around will be no different. Given historically low interest rates and pent-up demand, we expect the impact of this recession will evolve as in the past, with home sales and prices recovering into 2021.
Home buyers and sellers adjust their activities in March amid challenging circumstances
Metro Vancouver’s* housing market saw steady home buyer demand to begin March and a levelling off of activity as the month went on and concerns about the COVID-19 outbreak intensified.
The Real Estate Board of Greater Vancouver (REBGV) reports that residential home sales in the region totalled 2,524 in March 2020, a 46.1 per cent increase from the 1,727 sales recorded in March 2019, and a 17.4 per cent increase from the 2,150 homes sold in February 2020.
Last month’s sales were 19.9 per cent below the 10-year March sales average.
“The first two weeks of the month were the busiest days of the year for our region with heightened demand and multiple offers becoming more common,” Ashley Smith, REBGV president said, “Like other aspects of our lives, this changed as concerns over the COVID-19 situation in our province grew.”
Daily residential sales on the region’s MLS® were 138 on average in the first ten business days of the month. In the final ten business days of the month, the daily average declined to 93 sales.
“Many of the sales recorded in March were in process before the provincial government declared a state of emergency. We’ll need more time to pass to fully understand the impact that the pandemic is having on the housing market,” Smith said.
“In recent weeks, REALTORS® have been working to help and guide their clients through this uncertain period. Many people have understandably chosen to put their home buying or selling plans on hold for now. Other people have more urgent housing needs and we’re trying to work with them to address these needs in the safest and most responsible way possible.”
There were 4,436 detached, attached and apartment properties newly listed for sale on the Multiple Listing Service® (MLS®) in Metro Vancouver in March 2020. This represents a 10.4 per cent decrease compared to the 4,949 homes listed in March 2019 and a 10.8 per cent increase compared to February 2020 when 4,002 homes were listed.
The total number of homes currently listed for sale on the MLS® system in Metro Vancouver is 9,606, a 24.8 per cent decrease compared to March 2019 (12,774) and a 4.5 per cent increase compared to February 2020 (9,195).
“Realtors were named among the province’s list of essential services last week,” Smith said. “This means that we have a responsibility to do what we can to help residents meet their housing and shelter needs while strictly following the most up-to-date public health orders and physical distancing requirements from our health officials and government agencies.”
For all property types, the sales-to-active listings ratio for March 2020 is 26.3 per cent. By property type, the ratio is 21.1 per cent for detached homes, 33 per cent for townhomes, and 28.9 per cent for apartments.
Generally, analysts say downward pressure on home prices occurs when the ratio dips below 12 per cent for a sustained period, while home prices often experience upward pressure when it surpasses 20 per cent over several months.
The MLS® Home Price Index composite benchmark price for all residential properties in Metro Vancouver is currently $1,033,700. This represents a 2.1 per cent increase over March 2019, and a 1.3 per cent increase compared to February 2020.
Sales of detached homes in March 2020 reached 852, a 61.1 per cent increase from the 529 detached sales recorded in March 2019. The benchmark price for detached properties is $1,450,700. This represents a 0.7 per cent increase from March 2019, and a 1.2 per cent increase compared to February 2020.
Sales of apartment homes reached 1,179 in March 2020, a 35.1 per cent increase compared to the 873 sales in March 2019. The benchmark price of an apartment property is $687,000. This represents a 2.9 per cent increase from March 2019, and a 1.4 per cent increase compared to February 2020.
Attached home sales in March 2020 totalled 493, a 51.7 per cent increase compared to the 325 sales in March 2019. The benchmark price of an attached unit is $791,800. This represents a 2.5 per cent increase from March 2019, and a 0.9 per cent increase compared to February 2020.
A CLASSIC HOME! JUST LISTED! Make this your own! Perfect family neighbourhood & home for the growing family in 'Chilcotin Park' subdivision! Short walk to Laityview Elementary French Immersion school & Westview Secondary.
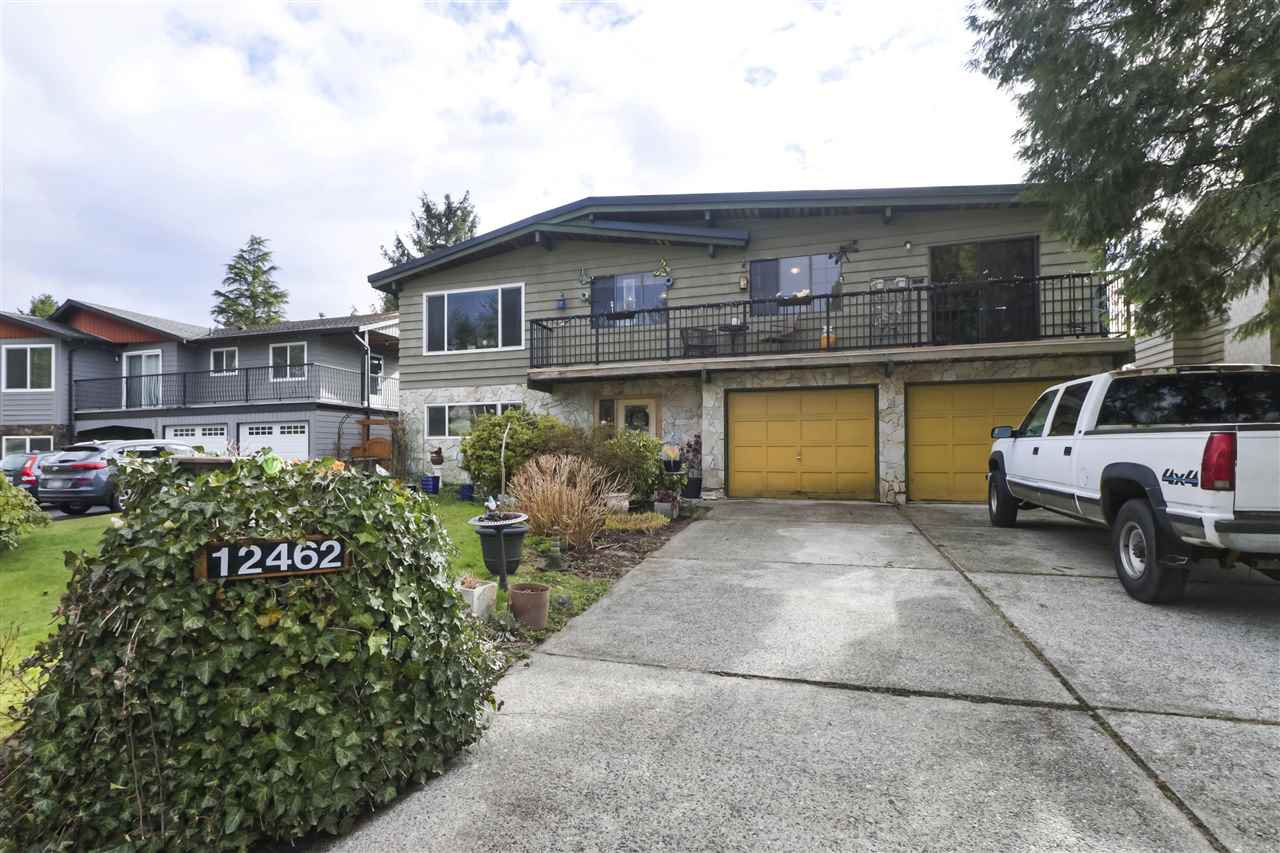
JUST LISTED! CHECKS SO MANY BOXES! Big yard! 4 bedrooms up! Quiet, no thru road! 1block to Highland Park Elementary!

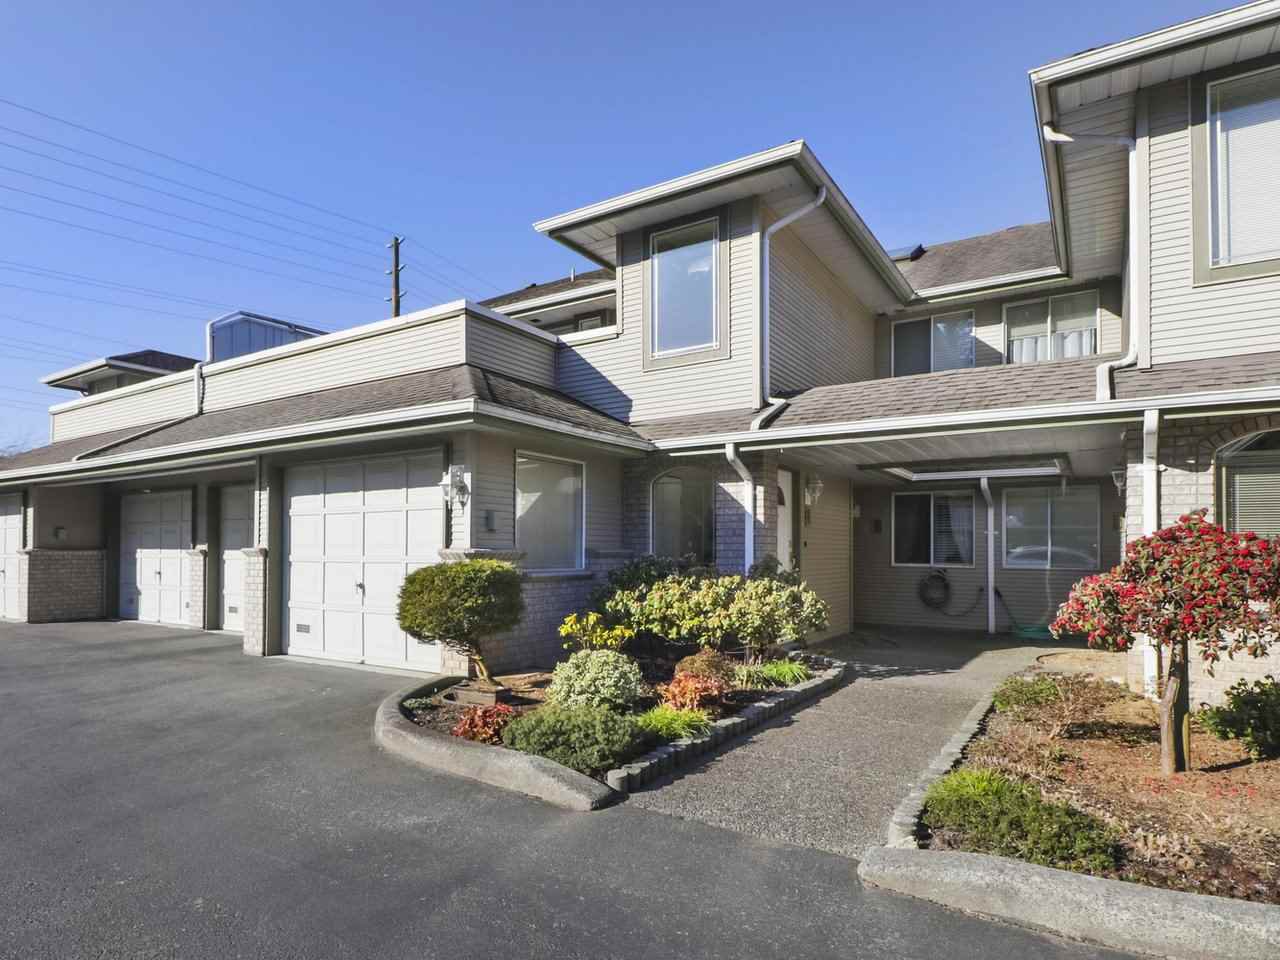
EXCITING NEW LISTING! Beautiful, ground floor townhome , perfect for retirees or 1st time Buyers!
Home buyers and sellers adjust their activities in March amid challenging circumstances
Metro Vancouver’s* housing market saw steady home buyer demand to begin March and a levelling off of activity as the month went on and concerns about the COVID-19 outbreak intensified.
The Real Estate Board of Greater Vancouver (REBGV) reports that residential home sales in the region totalled 2,524 in March 2020, a 46.1 per cent increase from the 1,727 sales recorded in March 2019, and a 17.4 per cent increase from the 2,150 homes sold in February 2020.
Last month’s sales were 19.9 per cent below the 10-year March sales average.
“The first two weeks of the month were the busiest days of the year for our region with heightened demand and multiple offers becoming more common,” Ashley Smith, REBGV president said, “Like other aspects of our lives, this changed as concerns over the COVID-19 situation in our province grew.”
Daily residential sales on the region’s MLS® were 138 on average in the first ten business days of the month. In the final ten business days of the month, the daily average declined to 93 sales.
“Many of the sales recorded in March were in process before the provincial government declared a state of emergency. We’ll need more time to pass to fully understand the impact that the pandemic is having on the housing market,” Smith said.
“In recent weeks, REALTORS® have been working to help and guide their clients through this uncertain period. Many people have understandably chosen to put their home buying or selling plans on hold for now. Other people have more urgent housing needs and we’re trying to work with them to address these needs in the safest and most responsible way possible.”
There were 4,436 detached, attached and apartment properties newly listed for sale on the Multiple Listing Service® (MLS®) in Metro Vancouver in March 2020. This represents a 10.4 per cent decrease compared to the 4,949 homes listed in March 2019 and a 10.8 per cent increase compared to February 2020 when 4,002 homes were listed.
The total number of homes currently listed for sale on the MLS® system in Metro Vancouver is 9,606, a 24.8 per cent decrease compared to March 2019 (12,774) and a 4.5 per cent increase compared to February 2020 (9,195).
“Realtors were named among the province’s list of essential services last week,” Smith said. “This means that we have a responsibility to do what we can to help residents meet their housing and shelter needs while strictly following the most up-to-date public health orders and physical distancing requirements from our health officials and government agencies.”
For all property types, the sales-to-active listings ratio for March 2020 is 26.3 per cent. By property type, the ratio is 21.1 per cent for detached homes, 33 per cent for townhomes, and 28.9 per cent for apartments.
Generally, analysts say downward pressure on home prices occurs when the ratio dips below 12 per cent for a sustained period, while home prices often experience upward pressure when it surpasses 20 per cent over several months.
The MLS® Home Price Index composite benchmark price for all residential properties in Metro Vancouver is currently $1,033,700. This represents a 2.1 per cent increase over March 2019, and a 1.3 per cent increase compared to February 2020.
Sales of detached homes in March 2020 reached 852, a 61.1 per cent increase from the 529 detached sales recorded in March 2019. The benchmark price for detached properties is $1,450,700. This represents a 0.7 per cent increase from March 2019, and a 1.2 per cent increase compared to February 2020.
Sales of apartment homes reached 1,179 in March 2020, a 35.1 per cent increase compared to the 873 sales in March 2019. The benchmark price of an apartment property is $687,000. This represents a 2.9 per cent increase from March 2019, and a 1.4 per cent increase compared to February 2020.
Attached home sales in March 2020 totalled 493, a 51.7 per cent increase compared to the 325 sales in March 2019. The benchmark price of an attached unit is $791,800. This represents a 2.5 per cent increase from March 2019, and a 0.9 per cent increase compared to February 2020.
Steady demand and low supply benefits home sellers
February saw steady home buyer demand and reduced home seller supply across Metro Vancouver.
The Real Estate Board of Greater Vancouver (REBGV) reports that residential home sales in the region totalled 2,150 in February 2020, a 44.9 per cent increase from the 1,484 sales recorded in February 2019, and a 36.9 per cent increase from the 1,571 homes sold in January 2020.
Last month’s sales were 15.6 per cent below the 10-year February sales average.
“Home buyer demand again saw strong year-over-year increases in February while the total inventory of homes for sale struggled to keep pace,” Ashley Smith, REBGV president said. “This was most pronounced in the condominium market.”
There were 4,002 detached, attached and apartment homes newly listed for sale on the Multiple Listing Service® (MLS®) in Metro Vancouver in February 2020. This represents a 2.8 per cent increase compared to the 3,892 homes listed in February 2019 and a 3.4 per cent increase compared to January 2020 when 3,872 homes were listed.
The total number of homes currently listed for sale on the MLS® system in Metro Vancouver is 9,195, a 20.7 per cent decrease compared to February 2019 (11,590) and a 6.7 per cent increase compared to January 2020 (8,617).
"Our Realtors are reporting increased traffic at open houses and multiple offer scenarios in certain pockets of the market. If you’re considering listing your home for sale, now is a good time to act with increased demand, reduced competition from other sellers, and some upward pressure on prices," says Smith.
For all property types, the sales-to-active listings ratio for February 2020 is 23.4 per cent. By property type, the ratio is 17.3 per cent for detached homes, 26.9 per cent for townhomes, and 28.4 per cent for apartments.
Generally, analysts say downward pressure on home prices occurs when the ratio dips below 12 per cent for a sustained period, while home prices often experience upward pressure when it surpasses 20 per cent over several months.
The MLS® Home Price Index composite benchmark price for all residential properties in Metro Vancouver is currently $1,020,600. This represents a 0.3 per cent increase over February 2019 and a 2.7 per cent increase over the past six months.
Sales of detached homes in February 2020 reached 685, a 52.9 per cent increase from the 448 detached sales recorded in February 2019. The benchmark price for a detached home is $1,433,900. This represents a 0.7 per cent decrease from February 2019 and a 1.9 per cent increase over the past six months.
Sales of apartment homes reached 1,061 in February 2020, a 39.8 per cent increase compared to the 759 sales in February 2019. The benchmark price of an apartment property is $677,200. This represents a 0.9 per cent increase from February 2019 and a 3.6 per cent increase over the past six months.
Attached home sales in February 2020 totalled 404, a 45.8 per cent increase compared to the 277 sales in February 2019. The benchmark price of an attached home is $785,000. This represents a 0.6 per cent increase from February 2019 and a 1.7 per cent increase over the past six months.
Home sale activity up, supply down to start 2020
Home sale and price activity remained steady in Metro Vancouver to start 2020 while home listing activity declined in January.
The Real Estate Board of Greater Vancouver (REBGV) reports that residential home sales in the region totalled 1,571 in January 2020, a 42.4 per cent increase from the 1,103 sales recorded in January 2019, and a 22.1 per cent decrease from the 2,016 homes sold in December 2019.
Last month’s sales were 7.3 per cent below the 10-year January sales average.
“We’ve begun 2020 with steady home buyer demand that tracks close to the region’s long-term average,” Ashley Smith, REBGV president said. “Looking at supply, we’re seeing fewer homes listed for sale than is typical for this time of year. As we approach the traditionally more active spring market, we’ll keep a close eye on supply to see if the number of homes being listed is keeping pace with demand.”
There were 3,872 detached, attached and apartment properties newly listed for sale on the Multiple Listing Service® (MLS®) in Metro Vancouver in January 2020. This represents a 20.1 per cent decrease compared to the 4,848 homes listed in January 2019 and a 143.8 per cent increase compared to December 2019 when 1,588 homes were listed.
Last month’s new listings were 17.4 per cent below January’s 10-year average.
The total number of homes currently listed for sale on the MLS® system in Metro Vancouver is 8,617, a 20.3 per cent decrease compared to January 2019 (10,808) and a 0.2 per cent increase compared to December 2019 (8,603), and is 13.7 per cent below the 10-year January average.
For all property types, the sales-to-active listings ratio for January 2020 is 18.2 per cent. By property type, the ratio is 11.6 per cent for detached homes, 22.6 per cent for townhomes, and 23.9 per cent for apartments.
Generally, analysts say downward pressure on home prices occurs when the ratio dips below 12 per cent for a sustained period, while home prices often experience upward pressure when it surpasses 20 per cent over several months.
The MLS® Home Price Index composite benchmark price for all residential properties in Metro Vancouver is currently $1,008,700. This represents a 1.2 per cent decrease over January 2019, a 1.4 per cent increase over the past six months, and a 0.8 per cent increase compared to December 2019.
Sales of detached homes in January 2020 reached 439, a 29.5 per cent increase from the 339 detached sales recorded in January 2019. The benchmark price for detached properties is $1,431,200. This represents a 1.7 per cent decrease from January 2019, a one per cent increase over the past six months, and a 0.5 per cent increase compared to December 2019.
Sales of apartment homes reached 814 in January 2020, a 45.6 per cent increase compared to the 559 sales in January 2019. The benchmark price of an apartment property is $663,200. This represents a one per cent decrease from January 2019, a 1.5 per cent increase over the past six months, and a one per cent increase compared to December 2019.
Attached home sales in January 2020 totalled 318, a 55.1 per cent increase compared to the 205 sales in January 2019. The benchmark price of an attached unit is $782,500. This represents a 0.7 per cent decrease from January 2019, a 1.6 per cent increase over the past six months, and a 0.5 per cent increase compared to December 2019.
Just Sold this great gem of a townhome, and once again so enjoyed working with a super client! 21491 Dewdney Trunk Rd

rking with a super client!


Cell (604) 230-7311
asurebetinrealestate@gmail.com
RE/MAX LifeStyles Realty
22308 Dewdney Trunk Rd
Maple Ridge, BC
V2X 3J2


 The data relating to real estate on this website comes in part from the MLS® Reciprocity program of either the Greater Vancouver REALTORS® (GVR), the Fraser Valley Real Estate Board (FVREB) or the Chilliwack and District Real Estate Board (CADREB). Real estate listings held by participating real estate firms are marked with the MLS® logo and detailed information about the listing includes the name of the listing agent. This representation is based in whole or part on data generated by either the GVR, the FVREB or the CADREB which assumes no responsibility for its accuracy. The materials contained on this page may not be reproduced without the express written consent of either the GVR, the FVREB or the CADREB.


